What you'll build
A load test that opens real HTTP/2 channels against your gRPC endpoint, makes unary calls from JSON templates, runs a bidirectional stream of unique messages from one template, and measures both the call latency and the application-level message round trip — scaled across concurrent virtual users, with pass/fail assertions you can gate CI on.
We'll go in three steps: a one-shot unary call from the CLI, a live channel
with a bidi stream, and the same test on the platform with its gRPC metrics
dashboard. Then the metrics model, assertions, and CI. Everything here is
free and open source — the std/grpc* actions ship in the perfscale
engine on every plan.
Prerequisites
-
The
perfscaleCLI (install instructions):npm install -g @perfscale/exe, orperfscale self-updateto be current (gRPC needs v0.7.0+) -
A gRPC endpoint to test. To follow along locally, the OSS repo ships an echo server (needs a Rust toolchain):
cargo run -p perfscale-core --example grpc_echo_serverIt listens plaintext on
127.0.0.1:50051with server reflection enabled and implementsperfscale.test.v1.EchowithUnary,ServerStream,ClientStream, andBidimethods (plusFailandLargefor edge cases). -
Against a real (
grpcs://, production) endpoint you need exactly one schema source: server reflection enabled on the server, or a descriptor set built once from your protos:protoc --descriptor_set_out=api.pb --include_imports api.proto base64 -i api.pb # macOS; on Linux: base64 -w0 api.pbThe base64 output goes into the step's
descriptor_set:field. No codegen, no stubs — the engine maps your JSON payloads to protobuf at run time using the standard protobuf-JSON rules.
Step 1 — A first unary call
The simplest gRPC test is std/grpc@v1: connect, load the schema, make one
unary call, close — one step, timed as one latency sample.
Create test.yaml:
steps:
  - name: unary smoke
    uses: std/grpc@v1
    with:
      url: grpc://127.0.0.1:50051
      reflection: true        # echo server has reflection on; prod may need descriptor_set
      method: "perfscale.test.v1.Echo/Unary"
      payload: { message: "ping-${seq}" }
    check:
      duration_ms_lt: 250
Native tests always run with a config. Create config.yaml:
vus: 1
duration: 10s
Run it:
perfscale run -f test.yaml -c config.yaml
Things worth knowing about this little file:
reflection: truetells the engine to pull the schema from the server's reflection service and cache it per URL for the rest of the run — nothing to generate, nothing to commit.payloadis plain JSON, mapped with protobuf-JSON rules (proto field names or their camelCasejson_name, 64-bit ints as strings, enums as names). The${seq}token expands per call, so every request carries a distinct message.- Methods are named
"package.Service/Method". A typo fails with a did-you-mean suggestion, and a bad schema fails fast — before any network I/O.
Reading the output: per-request lines stream live, then the summary prints.
A pure gRPC run is all grpc_* lines — gRPC steps never feed the
http_req_* series:
grpc_req_durationgets one sample per unary call — your call-latency histogram.grpc_msg_rttequals the request duration on a unary call (it gets interesting on streams — next step).grpc_msgs_sent/grpc_msgs_receivedcount one message each way per call.grpc_req_failedstays at 0 while the server answers OK (status0, the defaultexpect_status).
The run exits 0 even when checks fail — failed checks are load-test
feedback, printed to stderr and the summary, not a CLI error.
Step 2 — A live channel and a bidi stream
One-shot steps re-connect and re-load the schema on every call. Real load
holds a channel: std/grpc-connect@v1 opens a live HTTP/2 channel for
the rest of the iteration, and every call and stream rides it — the connect
and the schema load are paid once per iteration, not per call.
Replace test.yaml (this is the scenario that ships as
examples/grpc.test.yaml
in the OSS repo):
steps:
  - name: open channel
    uses: std/grpc-connect@v1
    with:
      url: grpc://127.0.0.1:50051
      reflection: true
    outputs: conn

  - name: unary echo
    uses: std/grpc-call@v1
    with:
      id: "${{ conn.id }}"
      method: "perfscale.test.v1.Echo/Unary"
      payload: { message: "ping-${seq}" }
    check:
      duration_ms_lt: 250

  - name: open bidi stream
    uses: std/grpc-stream-open@v1
    with:
      id: "${{ conn.id }}"
      method: "perfscale.test.v1.Echo/Bidi"
    outputs: stream

  - name: send events
    uses: std/grpc-stream-send@v1
    with:
      id: "${{ stream.id }}"
      payload: { message: "evt-${seq}" }
      repeat: 5
      interval_ms: 20

  - name: await echoes
    uses: std/grpc-stream-recv@v1
    with:
      id: "${{ stream.id }}"
      until_contains: "evt-5"
      timeout: 5000
    check:
      messages_count_gte: 5

  - name: close stream
    uses: std/grpc-stream-close@v1
    with: { id: "${{ stream.id }}" }

  - name: pace
    uses: std/sleep@v1
    with: { ms: 200 }
Bump the load in config.yaml:
vus: 5
duration: 30s
Run it again. The moving parts:
outputs: connstores the connect step's result; later steps address the channel as${{ conn.id }}. Channel and stream ids live only inside their VU's current iteration — whatever you leave open is dropped at iteration end (streams are cancelled), so callgrpc-stream-closewhen you want a clean, status-checked shutdown.- One template, 5 unique messages per stream:
${seq}expands per send, one message every 20 ms. until_contains: "evt-5"is the recv step's stopping rule: read until a message contains the last event. Alternatives:until_json(JSON-subset match) or plaincount: N.- The same family covers the other two streaming shapes: server-streaming
passes its single
payloadat open; client-streaming sends like bidi and gets its one response back fromgrpc-stream-close.
The summary from this run:
vus....................: 5 min=1 max=5
iterations..............: 140 4.67/s
grpc_msgs_received: 840 28.02/s
grpc_msgs_sent: 840 28.02/s
grpc_req_failed: 0 0.00/s
grpc_msg_rtt: avg=2.90ms p(50)=2.80ms p(90)=3.60ms p(95)=4.10ms p(99)=5.30ms min=1.90ms max=7.20ms count=280
grpc_req_duration: avg=2.95ms p(50)=2.85ms p(90)=3.70ms p(95)=4.20ms p(99)=5.40ms min=1.95ms max=7.40ms count=140
The counts tell the story: 140 iterations → 140 unary samples in
grpc_req_duration, and 280 grpc_msg_rtt samples — one per unary call
plus one per stream, where it records the time from a send to the first
reply matching your until-rule. Message counters: 6 sent and 6 received per
iteration (1 unary + 5 stream) = 840.
Step 3 — Run it on the platform
The same YAML runs on the platform unchanged — no k6 script, nothing to
install on your side. In the console, create a native test and paste
your test.yaml and config.yaml; environment-specific values (the target
URL, auth tokens) go into env variables referenced as ${{ vars.* }}.
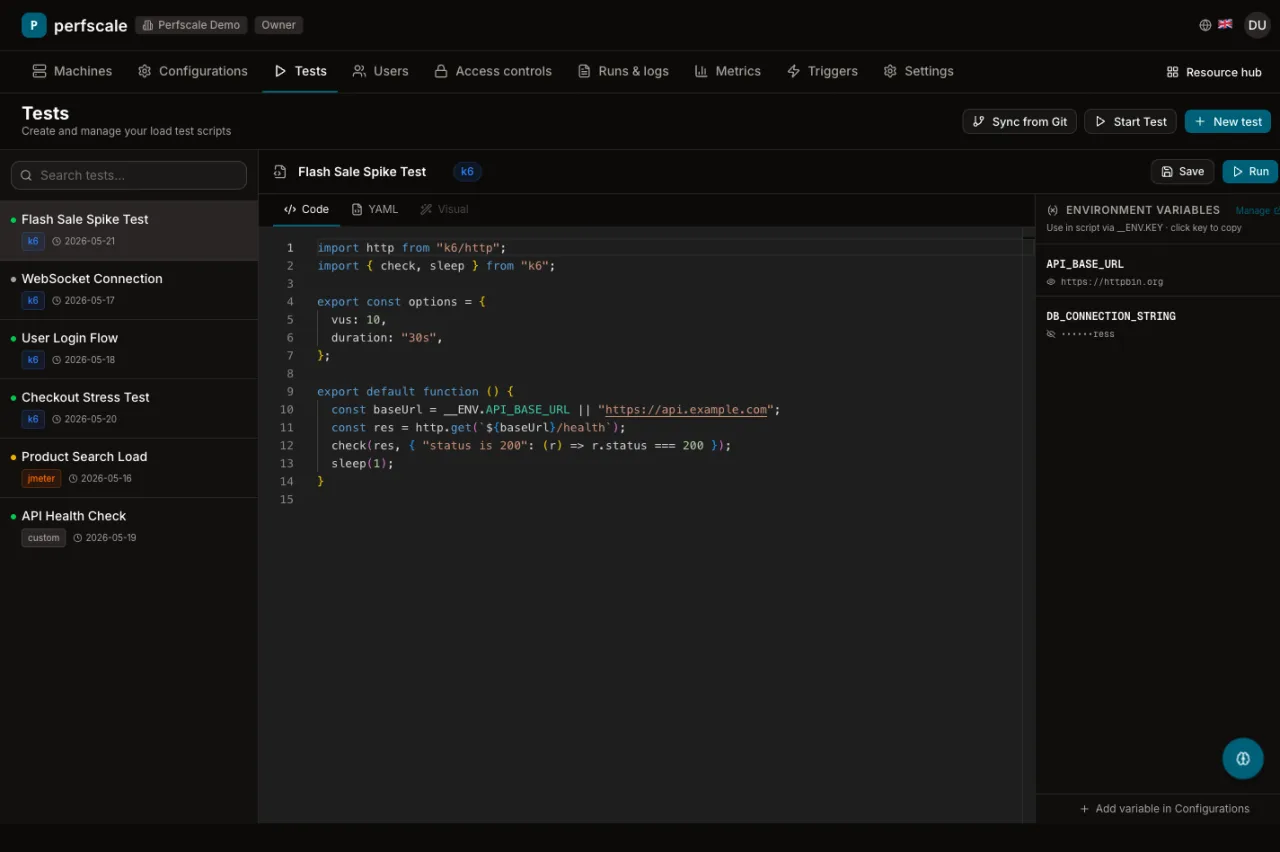
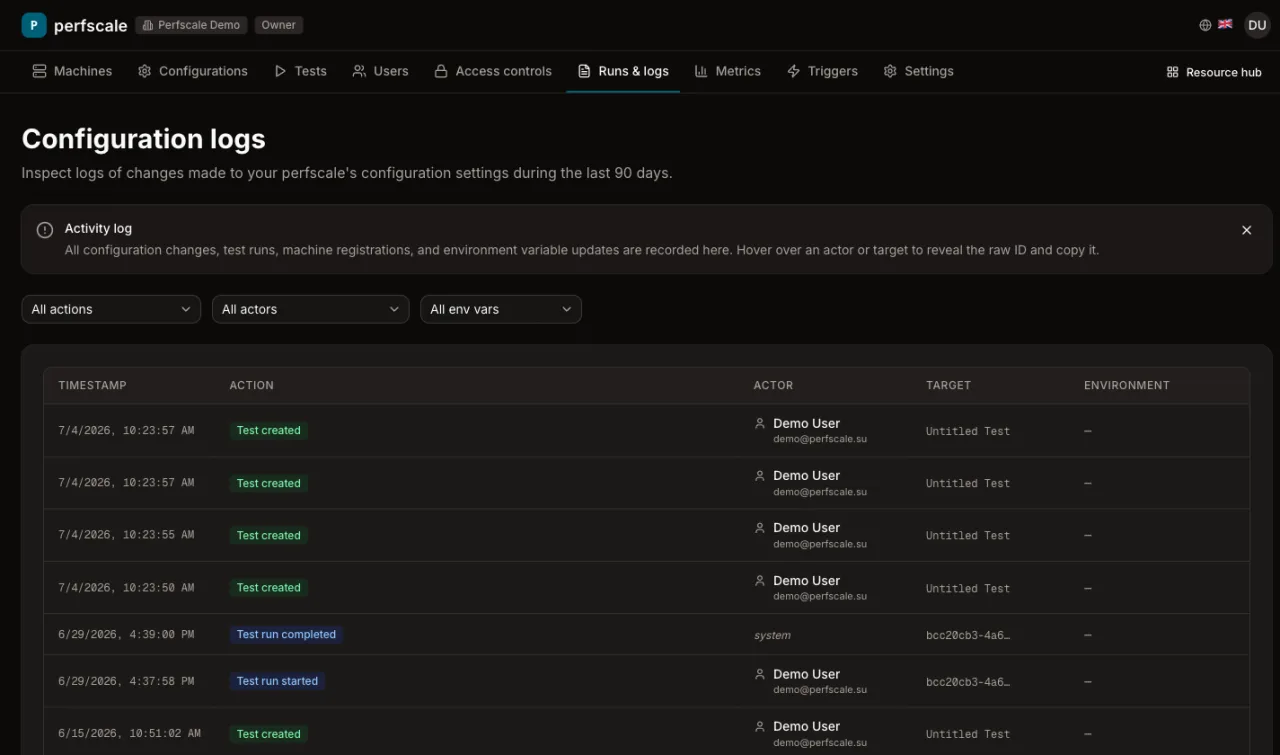
Pick the machines to generate load from — distributed workers apply the VUs in parallel, each holding its own channel per iteration — and start the run. The Runs page streams the logs live:
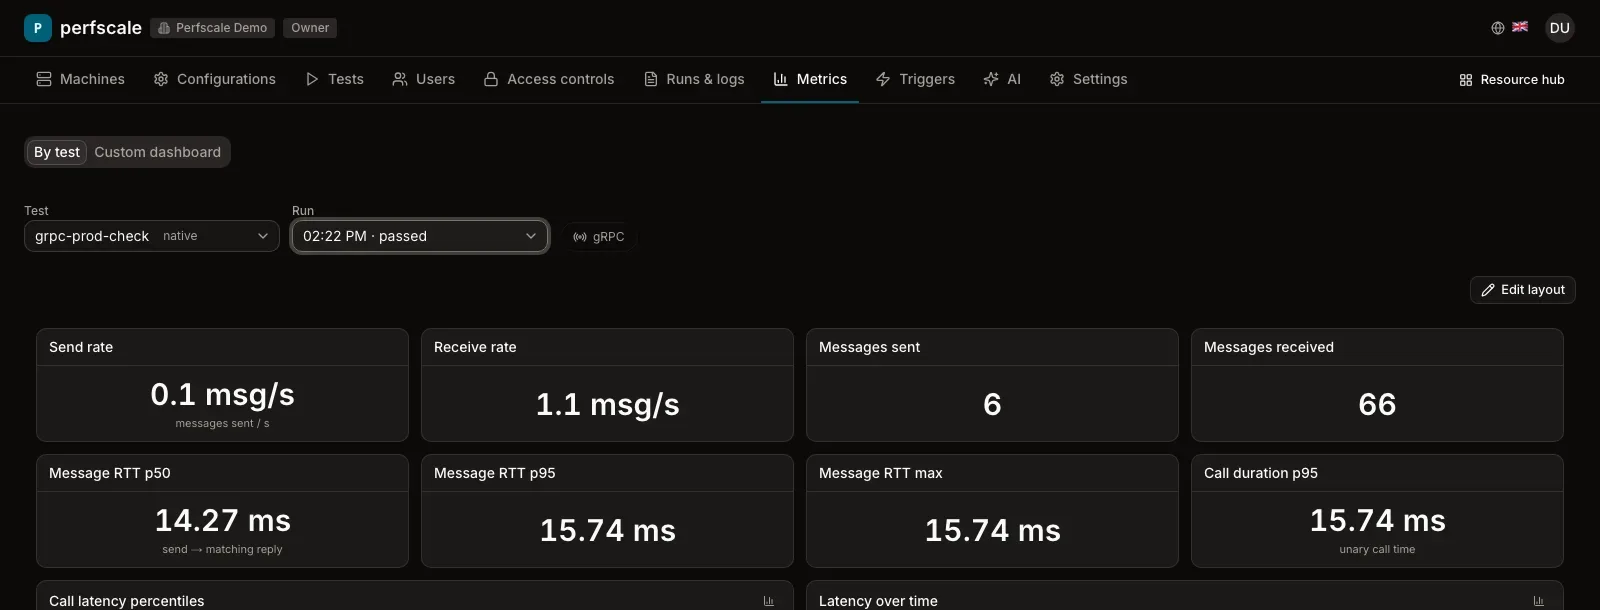
The run is detected as gRPC automatically, and the Metrics page switches to gRPC tiles: send/receive rates, message counters, message-RTT percentiles, and call duration:
gRPC metrics
| Metric | What it means |
|---|---|
grpc_req_duration | Unary call latency histogram (std/grpc@v1 and std/grpc-call@v1 only). Streams deliberately don't feed it — their lifetimes span your steps. |
grpc_msg_rtt | Application-level message RTT. Equals the request duration on a unary call; on a stream recv it's the send→matching-reply time, recorded only when an until_* rule matched and a send preceded it on the same stream. |
grpc_msgs_sent / grpc_msgs_received | Message throughput counters, per call and per stream step. |
grpc_req_failed | RPCs that did not meet expect_status. For streams, grpc-stream-close is what turns the final status into this counter. |
Two consequences: a failed connect emits no metrics (no RPC was made),
and gRPC steps never touch http_req_duration — the grpc_* series are
the whole story.
Assertions
Unary calls assert on the status code with expect_status (default 0 =
OK). Error-path tests read naturally — the echo server's Fail method
returns INVALID_ARGUMENT (status 3), so this step passes when the call
fails the right way:
  - name: error path
    uses: std/grpc-call@v1
    with:
      id: "${{ conn.id }}"
      method: "perfscale.test.v1.Echo/Fail"
      payload: { message: "boom" }
      expect_status: 3        # INVALID_ARGUMENT
Latency bounds go in a check (duration_ms_lt: 250, as in the steps
above). Stream receive/close steps expose a messages list, asserted with
at-least-one-matches semantics:
    check:
      messages_count_gte: 5                 # at least 5 messages arrived
      message_contains: "evt"               # some message contains the substring
      message_matches: { message: "evt-5" } # some message JSON-subset-matches
For deterministic exchanges, address one message by index:
check: { on: got.messages.0, message_matches: { message: "welcome" } }.
CI/CD
The same two files gate a pipeline. On GitHub, the
Perfscale/github-action step
installs the pinned CLI, runs your test (file + config inputs), and
packs the summary and metrics into an artifact. On GitLab, include: the
templates from Perfscale/gitlab-ci.
The full wiring — REST API triggers, webhooks back into CI — is in
CI/CD integration.
One gRPC-specific gotcha: --summary-export parses only the http_req_*
family, so a pure gRPC run exports summary: null. Gate on the grpc_*
stdout lines (or add a companion HTTP step) when you need a hard CI
threshold.
Next steps
- gRPC concepts — every parameter of the seven
std/grpc*actions, schema sources, and the token reference - gRPC from the CLI — the condensed CLI walkthrough
- gRPC Load Testing Goes Native — the announcement post with the background story